Understand Dataset
Data source: the dataset is from Kaggle. I uploaded it into BigQuery as a table called house_table under the dataset called house.
Data Schema:
| Type | Type | Mode |
|---|---|---|
| price | INTEGER | NULLABLE |
| area | INTEGER | NULLABLE |
| bedrooms | INTEGER | NULLABLE |
| bathrooms | INTEGER | NULLABLE |
| stories | INTEGER | NULLABLE |
| mainroad | BOOLEAN | NULLABLE |
| guestroom | BOOLEAN | NULLABLE |
| basement | BOOLEAN | NULLABLE |
| hotwaterheating | BOOLEAN | NULLABLE |
| airconditioning | BOOLEAN | NULLABLE |
| parking | INTEGER | NULLABLE |
| prefarea | BOOLEAN | NULLABLE |
| furnishingstatus | STRING | NULLABLE |
The goal is to predict the housing price based on certain factors like house area, bedrooms, furnished, nearness to main road, etc.
Transform Training Data
In the schema, we observe that the table encompasses various data types including strings, integers, and booleans. To utilize them as features in model training, data transformation is necessary. This transformation can be executed either directly within the create model query or by incorporating a brief preprocessing step to generate a transformed table.
I’ll illustrate the latter method since it’s straightforward to comprehend and convenient for model evaluation and prediction purposes.
- Transform the boolean columns to 1 and 0;
- Transform the string column ‘
funishingstatus‘ to 0,1,2 - Store the transformed data into a new table called transformed_table
CREATE OR REPLACE table `house.transformed_table`
AS
  SELECT
  price,
  area,bedrooms,bathrooms,stories,parking,
  IF(mainroad, 1, 0) AS mainroad,
  IF(guestroom, 1, 0) AS guestroom,
  IF(basement, 1, 0) AS basement,
  IF(hotwaterheating, 1, 0) AS hotwaterheating,
  IF(airconditioning, 1, 0) AS airconditioning,
  IF(prefarea, 1, 0) AS prefarea,
  CASE
    WHEN furnishingstatus = 'furnished' THEN 2
    WHEN furnishingstatus = 'semi-furnished' THEN 1
    WHEN furnishingstatus = 'unfurnished' THEN 0
  END AS furnishingstatus

  FROM
  `instruction-415216.house.house_table`
All columns have been transformed to numerical columns. It will look like this
| Row | price | area | bedrooms | bathrooms | stories | parking | mainroad | guestroom | basement | hotwaterheating | airconditioning | prefarea | furnishingstatus |
|---|---|---|---|---|---|---|---|---|---|---|---|---|---|
| 1 | 2275000 | 3970 | 1 | 1 | 1 | 0 | 0 | 0 | 0 | 0 | 0 | 0 | 0 |
| 2 | 2450000 | 3240 | 2 | 1 | 1 | 1 | 0 | 1 | 0 | 0 | 0 | 0 | 0 |
| 3 | 2450000 | 7700 | 2 | 1 | 1 | 0 | 1 | 0 | 0 | 0 | 0 | 0 | 0 |
| 4 | 2135000 | 3000 | 2 | 1 | 1 | 0 | 0 | 0 | 0 | 0 | 0 | 0 | 0 |
| 5 | 2345000 | 3640 | 2 | 1 | 1 | 0 | 1 | 0 | 0 | 0 | 0 | 0 | 0 |
Create a Regression Model
Since we completed the preprocessing, the building model step becomes quite simple now.
model_type='linear_reg'indicates that the model is linear regression.input_label_cols=['price']indicates that the targeted column(label) is price.
CREATE OR REPLACE MODEL `house.regression_model`
OPTIONS
  (model_type='linear_reg',
  input_label_cols=['price']) AS

  SELECT
    *
  FROM
  `instruction-415216.house.house_table`
Evaluate Regression Model
SELECT
  *
FROM
  ML.EVALUATE(MODEL `house.regression_model`,
    (
    SELECT
      *
    FROM
      `instruction-415216.house.transformed_table`));
The result will look like this
| Row | mean_absolute_error | mean_squared_error | mean_squared_log_error | median_absolute_error | r2_score | explained_variance |
|---|---|---|---|---|---|---|
| 1 | 774014.10869855888 | 1123846260167.2666 | 0.044876292109699546 | 568945.76711411029 | 0.71817696747086464 | 0.67826837158519 |
Mean Absolute Error (MAE): This metric calculates the average of the absolute differences between predicted and actual values. It gives a sense of the average magnitude of errors without considering their direction.
Mean Squared Error (MSE): MSE calculates the average of the squared differences between predicted and actual values. It penalizes larger errors more heavily than MAE since errors are squared, making it sensitive to outliers.
Mean Squared Logarithmic Error (MSLE): This metric calculates the mean of the squared differences between the natural logarithm of predicted and actual values. It’s particularly useful when dealing with data that has exponential growth, as it penalizes underestimates more than overestimates.
R-squared (R²): R-squared represents the proportion of the variance in the dependent variable that is predictable from the independent variables. It ranges from 0 to 1, with 1 indicating a perfect fit where the model explains all the variability of the response data around its mean.
Make a Prediction
SELECT
  *
FROM
  ML.EVALUATE(MODEL `house.regression_model`,
    (
    SELECT
      *
    FROM
      `instruction-415216.house.transformed_table`));
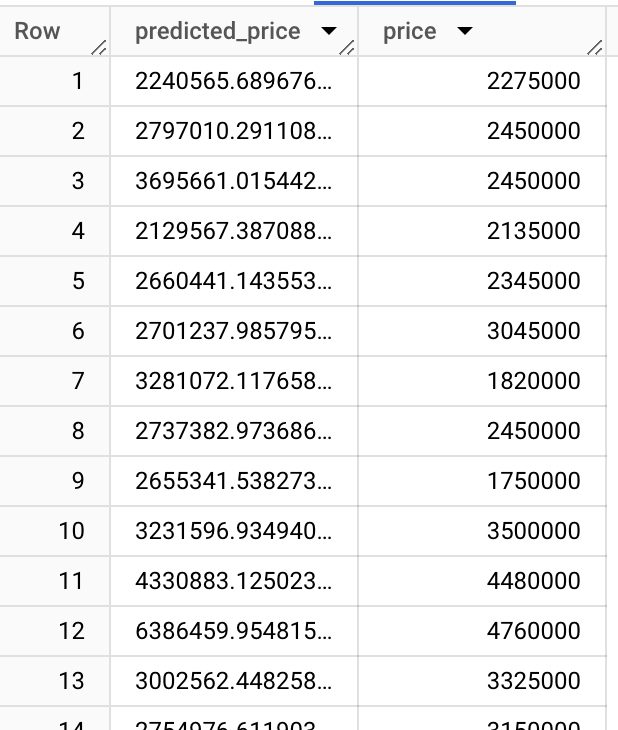
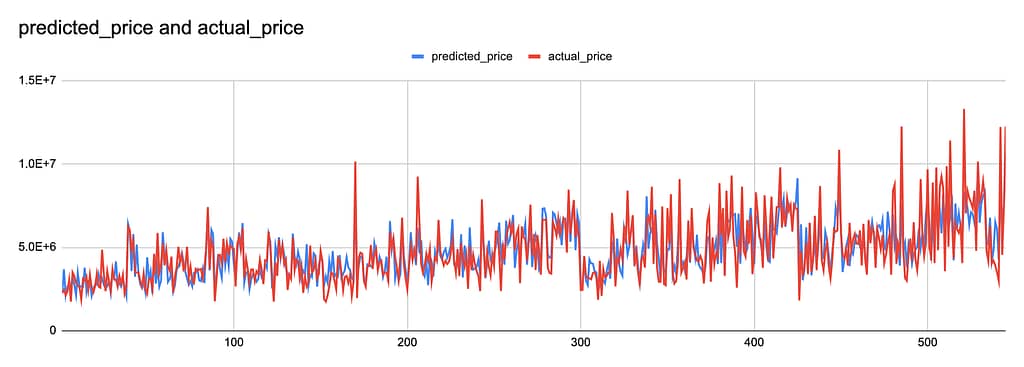
We can visualise it in line graph. It seems that the prediction is not bad.