Introduction
The web application, crafted using Streamlit, allows users to effortlessly choose a stock and customize their observation timeframe. Seamlessly, it delivers comprehensive insights into the selected stock’s performance, showcasing detailed price fluctuations and changes over the past years. Additionally, users can access key financial data to deepen their insights into the stock’s trends.
Key Features
- Identify the top 10 stocks in your selection effortlessly.
- Customise your timeframe to suit your analysis needs.
- Experience an intuitive and straightforward display of trends for easy interpretation.
- Trace the stock price and can send price alert to user.
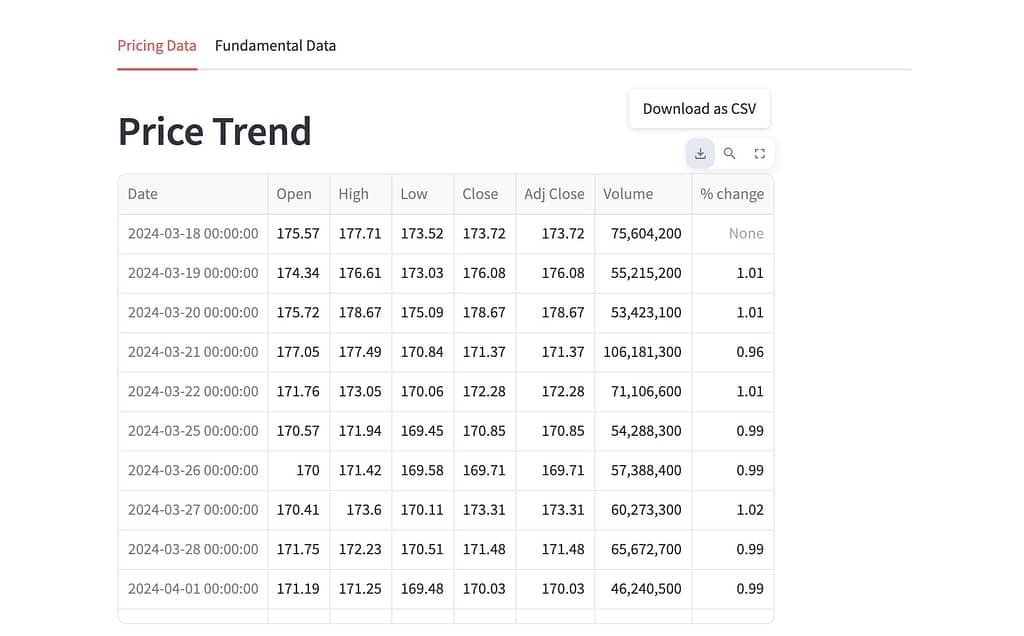
- Download the Price data with one click.
- Access comprehensive financial statements for a deeper understanding of market dynamics.
Tech Stack
- Python
- Streamlit
- Plotly
- Yahoo Finance API
- SendGridAPI
- Alpha Vantage API