1. What are outliers?
Outliers in data analysis are data points that significantly deviate from the rest of the observations in a dataset. These data points are often unusual or unexpected when compared to the overall pattern of the data.
Outliers can emerge for a variety of reasons, such as errors in measurement, mistakes during data entry, inherent natural fluctuations, or even as a result of truly exceptional observations. It’s crucial to differentiate between legitimate outliers, which genuinely portray extreme values, and erroneous outliers, which stem from inaccuracies or anomalies.
2. Detect Outliers
There are too ways to identify outliers, which are :
- Standard deviation method. It is useful when the data have an approximately symmetric distribution ( The perfect bell curve)
- The IQR method, it is very useful then the distribution is not like symmetric distribution.
2.1 Standard deviation method
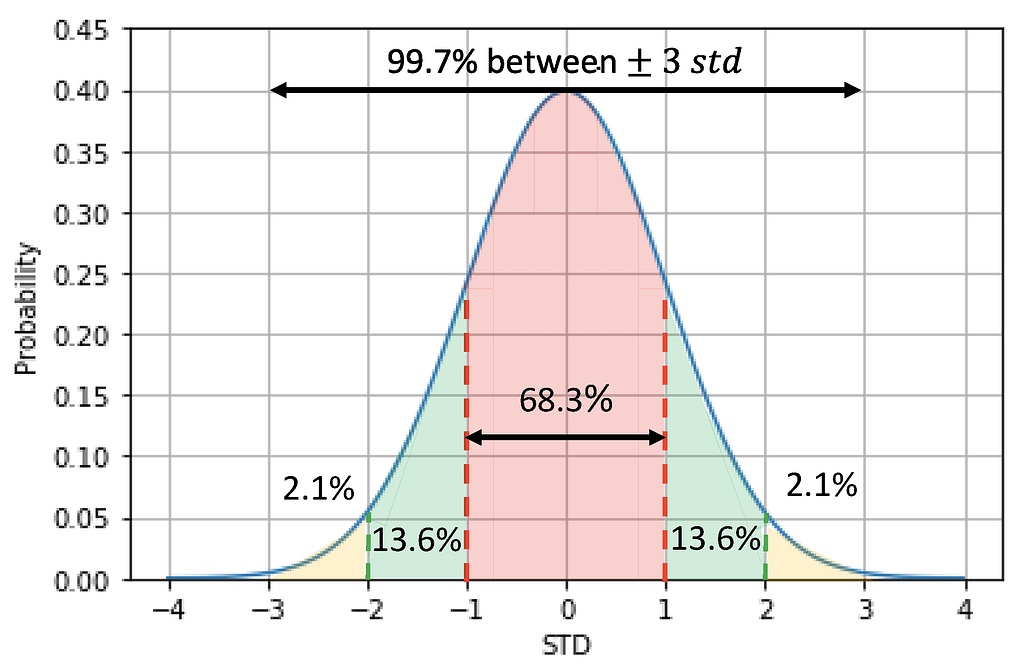
Here is an example of bell-shaped (normal) distribution. The normal distribution is fully described by two parameters: the mean (μ) and the standard deviation (σ). The mean represents the central location of the distribution, while the standard deviation measures the spread or dispersion of data points around the mean.
The bell curve represents the probability density.
- Within one standard deviation of the mean falls 68.3% of the data
- Within two standard deviation of the mean falls 95.5% (68.3%+13.6%+13.6%)of the data
- Within three standard deviation of the mean falls 99.7% (95.5% +2.1%+2.1%)of the data
There are , any points outside three standard deviation of the mean, we can regard them as outliers, because their probability is around only 0.3%.
2.2 Boxplot and IQR method
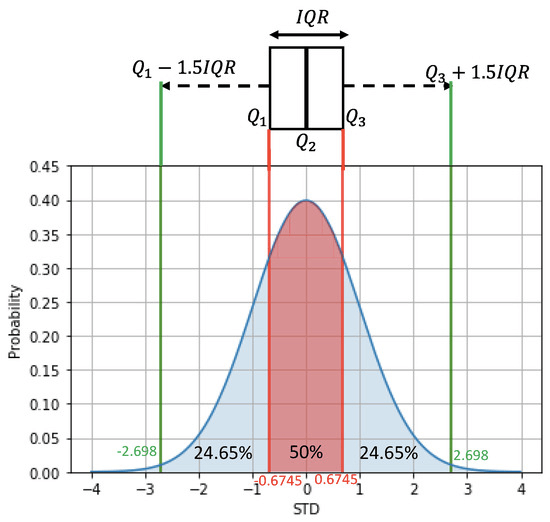
The below graph is a combination of a boxplot and normal distribution. Let’s have a closer look of the boxplot.
- The box represents the interquartile range (IQR), which is the range between the first quartile (Q1) and the third quartile (Q3). 50% of data falls in this area.
- The Q1 means the first quartile of the data (25%)
- The Q3 means the first quartile of the data (75%)
- The whiskers represents the minimum (Q1-1.5*IQR) and maximum values ((Q1+1.5*IQR)) within a defined range
Therefore, any points outside of the whiskers can be regarded as outliers.
3. Outlier detection practice in Python
Let’s start with creating a dataset named ‘salary’
import pandas as pd; import numpy as np;
import matplotlib.pyplot as plt; import seaborn as sns

def generate_salary(mean=5000,std_dev=100,num_samples=200):
    np.random.seed(2023)
   salary = np.random.normal(loc=mean,scale=std_dev,size=num_samples)
   salary = np.round(salary, decimals=0)
   return salary

df = generate_salary()
df = pd.DataFrame(df, columns =['salary'])
Let’s make a histogram plot. Well, it seems like perfect bell shape and we can not see the outliers directly.
sns.displot(df).set(title="Distribution of Salary", xlabel="Salary")
plt.show()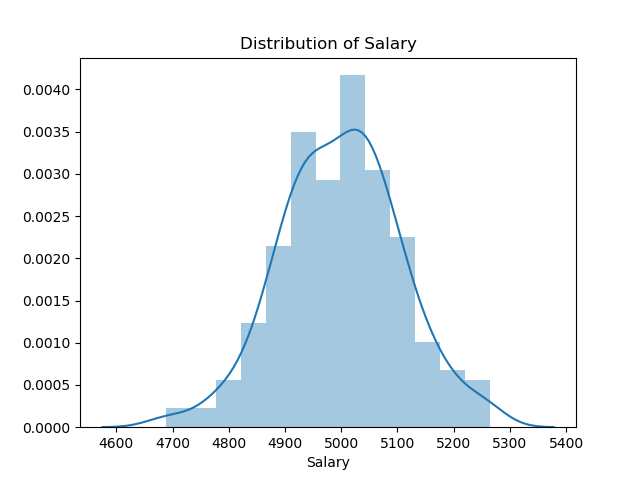
Then let’s make a boxplot. We can see the outliders, which are at the left side of the minimum whisker.
sns.boxplot(df) 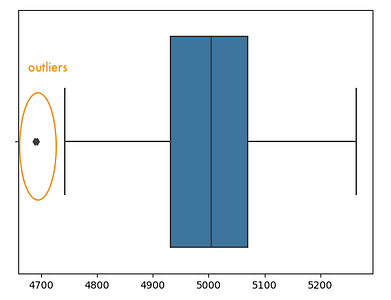
We also can use the IQR method to detect the outliers. Firstly, Let’s check the statistical information of the dataset.
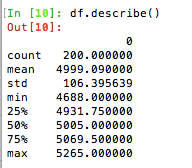
We can use the quantile 75%, which is 5069.50, and quantile 25%, which is 4688.09 to calculate the IQR. It is the easiest way. But if you try to avoid any hard typing, you can use this way to find out the Quantile result.
q25,q75 = np.percentile(a = df,q=[25,75])
IQR = q75 - q25   # well, IQR = 137.75

upper_limit = q75 + 1.5*IQR
lower_limit = q25 - 1.5*IQR
With upper limit and lower limit, we can rule out the outliers.
df_no_outliers = df[(df['salary']>lower_limit) & (df['salary']<upper_limit)]
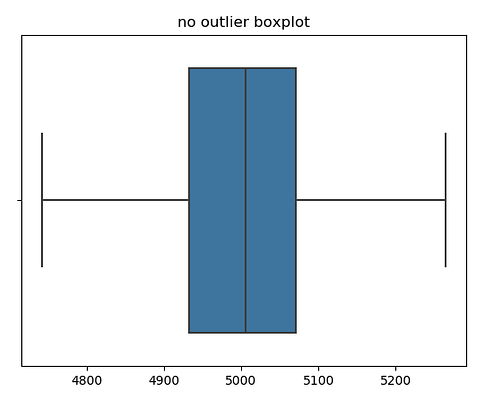
# let's do the boxplot again and check whether we removed all the outliers
sns.boxplot(df_no_outliers).set_title('no outlier boxplot')
plt.show()