In this tutorial you will learn
Source data has been uploaded to Github, click here. If you need the full tutorial jupyter notebook, click here
1. Create a SparkSession
from pyspark.sql import SparkSession
spark = SparkSession.builder.appName('tutorial').getOrCreate()
2. Load and show dataset
# read dataset and show the header
df = spark.read.option('header','true').csv('raw.githubusercontent.com/ivywang-ds/PySpark-from-zero-to-hero/main/bike_rental.csv')
# check schema
df.printSchema()

# show data
df.show()
3. Check duplicates values
# check the all columns name
df.columns

# check the duplicated record in the whole dataset
df_dup = df.groupBy('rental_id',
 'duration',
 'duration_ms',
 'bike_id',
 'bike_model',
 'end_date',
 'end_station_id',
 'end_station_name',
 'start_date',
 'start_station_id',
 'start_station_name',
 'end_station_logical_terminal',
 'start_station_logical_terminal',
 'end_station_priority_id').count().filter('count>1')

df_dup.collect()

# you should see this:an empty list
[]
4. Check missing values
from pyspark.sql.functions import col, sum

# Check for missing values in all columns
missing_values_count = df.select([sum(col(c).isNull().cast("int")).alias(c) for c in df.columns])

# Display the results
missing_values_count.collect()

# you should see this: it shows the number of missing value in each column

Row(rental_id=0, duration=0, duration_ms=0, bike_id=0, bike_model=13432, end_date=0, end_station_id=502, end_station_name=0, start_date=0, start_station_id=0, start_station_name=0, end_station_logical_terminal=47368, start_station_logical_terminal=47368, end_station_priority_id=47368)]
5. Extract date and time from datetime column
# parse datetime and extract year, month, day of week, hour of day
from pyspark.sql.functions import year, month, dayofweek, hour

# Extract year
df = df.withColumn("year", year("start_date"))

# Extract month
df = df.withColumn("month", month("start_date"))

# Extract day of the week (1 = Sunday, 2 = Monday, ..., 7 = Saturday)
df = df.withColumn("day_of_week", dayofweek("start_date"))

# Extract hour of the day
df = df.withColumn("hour_of_day", hour("start_date"))

# show the related columns with top 10 rows
df.select('year','month','day_of_week','hour_of_day').show(10)

# you should see this
+----+-----+-----------+-----------+
|year|month|day_of_week|hour_of_day|
+----+-----+-----------+-----------+
|2022|   10|          5|         22|
|2022|    9|          3|         21|
|2022|   12|          5|         10|
|2022|   11|          7|         20|
|2023|    1|          7|         18|
|2022|   12|          7|         17|
|2022|   10|          1|         12|
|2022|    7|          7|         17|
|2022|   10|          3|         21|
|2022|   11|          6|         12|
+----+-----+-----------+-----------+
only showing top 10 rows
5. Create a new Column
# add a new column called 'duration_min'

from pyspark.sql.functions import col, round

df = df.withColumn("duration_min",df["duration"]/60)
df = df.withColumn("duration_min", round(col("duration_min"),2))

# check the distribution of duration_min
df.describe(['duration_min']).show()

# you should see this
+-------+------------------+
|summary|      duration_min|
+-------+------------------+
|  count|             47368|
|   mean| 36.81580645161297|
| stddev|228.91379025049127|
|    min|              0.05|
|    max|          24055.77|
+-------+------------------+
5. Group, Aggregate, and Filter data
# group by single column
df.groupby('year').count().show()

+----+-----+
|year|count|
+----+-----+
|2023| 3415|
|2022|43953|
+----+-----+

# group by multiple columns
df.groupby(['year','month']).count().show()
+----+-----+-----+
|year|month|count|
+----+-----+-----+
|2022|   10|12038|
|2022|    2|  779|
|2022|    7| 2159|
|2022|   11| 8424|
|2022|    3| 1425|
|2022|    1|  796|
|2022|    5| 1859|
|2022|    6| 2270|
|2022|    9| 4608|
|2022|    4| 1670|
|2022|   12| 5845|
|2023|    1| 3415|
|2022|    8| 2080|
+----+-----+-----+

# with filter
df.filter(df['year']== '2022').groupby(['year','month']).count().orderBy('month').show()
+----+-----+-----+
|year|month|count|
+----+-----+-----+
|2022|    1|  796|
|2022|    2|  779|
|2022|    3| 1425|
|2022|    4| 1670|
|2022|    5| 1859|
|2022|    6| 2270|
|2022|    7| 2159|
|2022|    8| 2080|
|2022|    9| 4608|
|2022|   10|12038|
|2022|   11| 8424|
|2022|   12| 5845|
+----+-----+-----+
6. Make business insights
Question1 : which time of day that people prefer renting a bike?
df.filter(df['year']== '2022').groupby(['hour_of_day']).count().orderBy('hour_of_day').show()

# you should see this
+-----------+-----+
|hour_of_day|count|
+-----------+-----+
|          0| 1015|
|          1|  687|
|          2|  478|
|          3|  310|
|          4|  190|
|          5|  159|
|          6|  153|
|          7|  385|
|          8| 1255|
|          9| 2467|
|         10| 2839|
|         11| 2019|
|         12| 2002|
|         13| 2445|
|         14| 2599|
|         15| 2741|
|         16| 2771|
|         17| 3008|
|         18| 3618|
|         19| 4133|
+-----------+-----+
only showing top 20 rows
The solution is correct but the result is not clear enough. We can create a new column and assign time_of_day such as ‘morning’, ‘afternoon’, ‘evening’ and ‘night’.
from pyspark.sql.functions import when

df = df.withColumn(
    "time_of_day",
    when((col("hour_of_day") >= 6) & (col("hour_of_day") < 12), "morning")
    .when((col("hour_of_day") >= 12) & (col("hour_of_day") < 18), "afternoon")
    .when((col("hour_of_day") >= 18) & (col("hour_of_day") < 24), "evening")
    .otherwise("night")
)

df.filter(df['year']== '2022').groupby(['time_of_day']).count().orderBy('time_of_day').show(
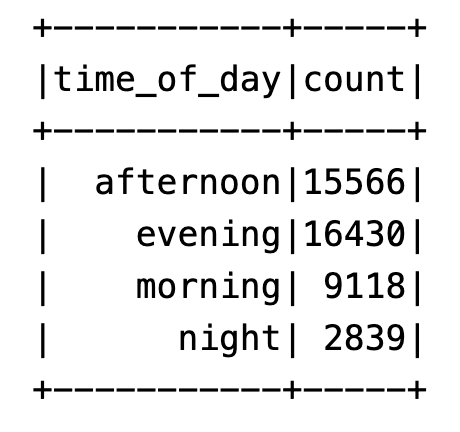
From the result we can see, most of people rent bikes in the afternoon and evening, only a few people rent bikes in the night.
This observation prompts the consideration that focusing on bike maintenance during the early morning and late evening, despite potential associated labor costs, could be a strategic choice to uphold the overall quality of the bikes in our fleet.
Question 2: What about the bike usage frequency? Have they been used once or multiple times? Should we invest in more bikes?
data = df.filter(df['year'] == '2022') \
              .groupBy('bike_id') \
              .count() \
              .orderBy('count', ascending=False) \
              .withColumnRenamed('count', 'Bike_rent') \
              .groupBy('Bike_rent').count().orderBy('Bike_rent').show()
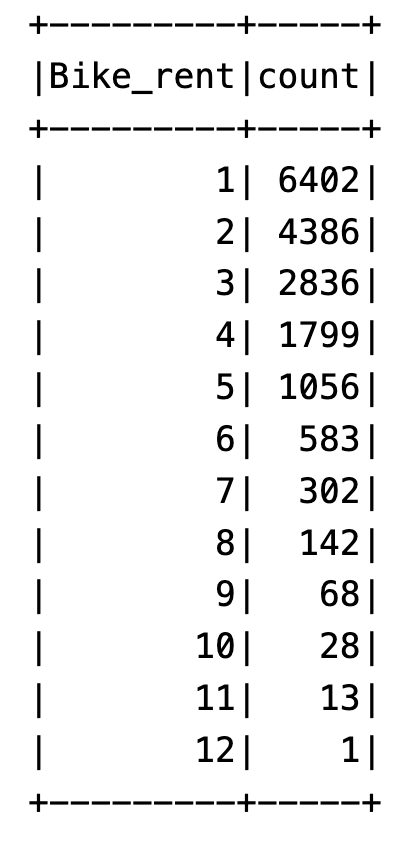
From the result we can see, most of bikes have been used only once or twice. Only one bike has been used once.
We should encourage people to rent the current bikes instead of investing in more bikes.
7. End session
# close the session and clean up
spark.stop()